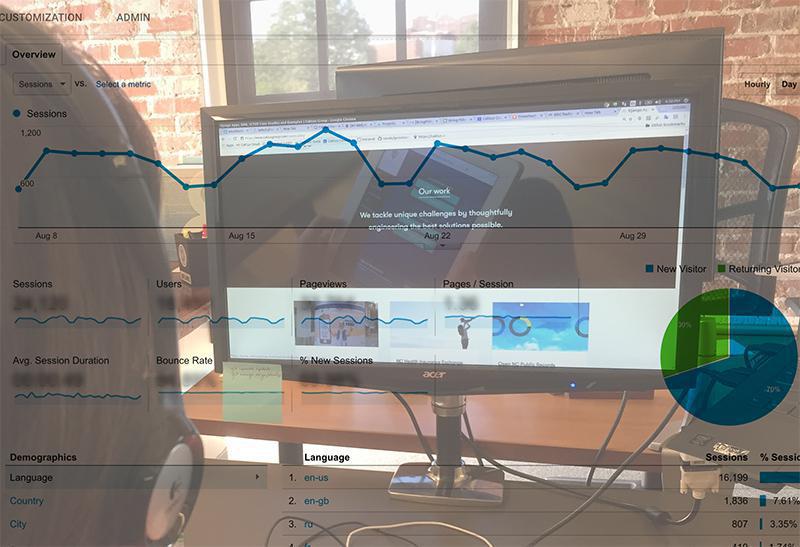
Is analytics data collected for a website, an application, or a game sufficient to understand what problems users encounter while interacting with it and what prevents their full engagement?
Why would you want to engage your client in a discovery workshop or your client’s users in user interviews, user surveys, or usability testing sessions, if you can simply look at the data gathered by an analytics tool, and tell with a high level of precision what’s working, and what is not?
“The biggest issue with analytics is that it can very quickly become a distracting black hole of “interesting” data without any actionable insight.” - Jennifer Cardello, Nielsen Norman Group
What metrics do you get out of data analytics?
Analytics tools track and assemble data from events that happen on an existing website or in an application.
The type of quantitative data you can collect with an analytics tools include:
- Number of visits/sessions
- Average duration of visits/sessions
- Number of unique visitors
- Average time on page
- Percentage of new visits
- Bounce rate
- Sources of traffic
- List of pages where users exit the website/application
It is an abundant source of information. Data analytics tell you what users do on your website and where—and on which pages—they do it.
So what’s missing from this picture?
While data analytics are incredibly powerful in identifying the “whats” and the “wheres” of your website/application’s traffic, they tell you nothing about the “why.” And without an answer to the “why,” you are a step away from misinterpretation.
Data analytics can be misleading if not supported by insights from qualitative user research
Let’s say you notice that an average visit time on a given page is high. You might be tempted to congratulate yourself for having created such an engaging experience that users spend several minutes on the page. But it is equally possible that the experience you have created is confusing. It takes users a lot of time to make sense of what they are looking at on the page, and they’re spending all that time in deep frustration.
Quantitative data can track user's journey through your website or application. They help you ask better questions, verify hypotheses about patterns of usage, and optimize the application’s performance to align with desired user behaviors.
What data analytics cannot do is identify usability issues. Usability issues and their causes are best diagnosed through usability testing.
Don’t take my word for it
UX professionals frequently report their own and their clients’ inability to draw conclusive answers from data analytics alone. Below are a few insights from conversations I’ve had with UX practitioners on the UX.guide Slack channel.
Christian Ress, co-founder at PlaytestCloud (a mobile game usability testing platform) says that customers often come to them because they spotted issues during soft-launch through their analytics. They see, for example, low interaction with certain features, retention issues, much higher number of attempts for certain game levels, but they do not understand what is causing those problems. It is through remote usability and playability testing sessions that the causes of the problems signaled by quantitative data can be discovered. Remote usability and playability testing involves recording players and prompting them to think out loud during all gameplay sessions.
David Sharek, the founder of UX.guide, finds the greatest challenge in data overload, when a lot of quantitative information is collected without a sufficient amount of time spent on defining the problem. David approaches an investigation into product performance and usability like any research experiment. He formulates a hypothesis and sets out to test it. The quantitative data he collects with an analytics tool Piwik helps him verify hypotheses about the “what” of user behavior. Then he drills deeper into the “why” by talking to users.
Vivien Chang, a UX designer at Brisbane, points out that quantitative methods are used to confirm or disconfirm working hypotheses about the usage patterns within an application, and they require a significant amount of data to do so. Qualitative methods, on the other hand, are tools to gain an understanding of underlying reasons for user actions and user’s motivations. In other words, you collect quantitative data to learn how people use your website or application. That information in itself gives you little or no insight into what problems users might be encountering in the process. To identify and counter usability issues, you should conduct qualitative studies such as usability testing.
What’s the secret sauce?
When you build a product such as a website or an application, you must pay attention to user experience. Your product’s success is not merely dependent on a cutting edge technology you may have employed; it depends on users (or customers) adopting the product. And increasingly sophisticated and savvy users won’t settle for a mediocre experience. You must give them the best experience you can.
How do you build a great experience? By taking strategic advantage of all the tools in your toolbox. You begin the journey by exploring the problem to be solved, understanding the users, and the broader context in which they function. Through discovery workshops, you build a shared understanding with all stakeholders and work together as a team to design a great solution. You monitor potential and actual usability pain points by testing the product iterations with users and adjusting the product’s design accordingly. You measure performance and monitor user behavior patterns with data analytics to further back up your product strategy decisions. Then you dig deeper to understand the causes of user actions by conducting more usability testing.
There you have it; the secret sauce to understanding the “what,” the “where,” and the “why” of user experience by tying together quantitative and qualitative user research methods.

